


These Are the 31 Markets Where Home Prices Have Fallen the Most

Real estate is changing fast, and so must you. Inman Connect San Diego is where you turn uncertainty into strategy — with real talk, real tools and the connections that matter. If you’re serious about staying ahead of the game, this is where you need to be. Register now!
Home prices have come down by at least a full percentage point in nearly one-third of the 100 largest U.S. housing markets even as many homebuyers stretch their finances to the limits to take out a mortgage.
Several markets have seen double-digit price declines from recent peaks, as price softening continues to spread from the Sunbelt into the Western U.S., ICE Mortgage Technology reported Monday.
While the inventory of homes for sale continues to grow at an accelerating pace, it remains to be seen whether softening home prices will keep some would-be sellers on the sidelines — as happened in late 2022 and early 2023, ICE reported.
ICE’s latest Mortgage Monitor Report suggested the market is on track to return to pre-pandemic inventory levels this fall, with listings already normalized in 39 of the 100 largest markets and 11 more on pace to get there by the end of the year.
Denver, where listings are up 100 percent from 2017-2019, has posted the biggest inventory gains, followed by Lakeland, Florida and Colorado Springs, Colorado (up 87 percent), Austin (up 69 percent) and Seattle (up 61 percent).
“California continues to be an area to watch closely, with the 10 largest markets seeing 42-75 percent inventory growth over the past 12 months,” ICE analysts noted. “While only three of its 10 largest markets (San Francisco, San Jose, and Stockton) have normalized, the remaining seven are on pace to do so by the end of this year, which could lead to softening price dynamics across the state.”
Swelling inventory and mortgage rates in the high sixes continues to cool home price growth, with early June data showing national home prices appreciated by just 0.3 percent on a seasonally adjusted annualized rate, ICE reported.
While home prices continue to climb in many Midwest and Northeast markets, 41 Sunbelt and Western markets saw prices drop on a seasonally adjusted basis in June.
Markets in Texas and Florida have seen double-digit price declines from peak levels, and parts of California, Arizona, Colorado, and Idaho have also seen prices come down more than 3 percent from recent highs.
“Thirty-one of the 100 largest markets in the U.S. have now seen prices dip by at least a full percentage point from their recent highs, suggesting the number of markets experiencing annual price declines may be poised to trend higher in coming months,” ICE analysts said.
Markets with biggest price declines from peak
- Austin, Texas (-19.7 percent)
- Cape Coral, Florida (-13.3 percent)
- North Port, Florida (-11.2 percent)
- San Francisco, California (-8.9 percent)
- Phoenix Arizona (-5.7 percent)
- San Antonio, Texas (-5.2 percent)
- Boise City, Idaho (-5.2 percent)
- Deltona, Florida (-4.0 percent)
- Stockton, California (-3.7 percent)
- Denver, Colorado (-3.6 percent)
- Tampa, Florida (-3.5 percent)
- Dallas, Texas (-3.2 percent)
- Palm Bay, Florida (-3.1 percent)
- Lakeland, Florida (-3.1 percent)
- Sacramento, California (-3.0 percent)
- San Jose, California (-2.9 percent)
- Provo, Utah (-2.8 percent)
- Miami, Florida (-2.3 percent)
- Colorado Springs, Colorado (-2.3 percent)
- Jacksonville, Florida (-2.2 percent)
- Oxnard, California (-1.9 percent)
- Orlando, Florida (-1.9 percent)
- Seattle, Washington (-1.9 percent)
- Portland, Oregon (-1.8 percent)
- Ogden, Utah (-1.6 percent)
- Los Angeles, California (-1.4 percent)
- Salt Lake City, Utah (-1.3 percent)
- San Diego, California (-1.3 percent)
- Bakersfield, California (-1.2 percent)
- Memphis, Tennessee (-1.2 percent)
- Riverside, California (-1.1 percent)
Seasonally adjusted price changes from local market post-pandemic peaks. Source: ICE Mortgage Monitor, July 2025.
While mortgage lenders are seeing an uptick in applications, underwriting standards remain tight and buyers face “significant affordability challenges,” ICE noted.
With average back-end debt-to-income ratios hitting 40 percent in May, borrowers needed an average credit score of 738, close to last year’s high.
“Loan amounts for purchase loans topped an average of more than $375,000 in May, and the average loan-to-value ratio topped 85 percent, so affordability is very stretched,” ICE reported.
To get their foot in the door, just over 5 percent of homebuyers are relying on adjustable-rate mortgages, and another 3 percent are opting for temporary interest rate buydowns.
More homeowners are underwater
While falling home prices could provide relief for homebuyers, they could also leave more homeowners underwater on their loan — owing more than their house is worth.
For now, ICE estimates that only about 538,000 homeowners are underwater, up from 339,000 a year ago.
But another 2.5 million homeowners have less than 10 percent equity in their home, up from 2 million a year ago.
If home prices fall by 10 percent, they’ll be underwater too — making it harder to avoid foreclosure if they have trouble making their mortgage payments.
“While the number of homeowners underwater on their mortgage is still relatively low, it’s beginning to grow in some markets, especially among mortgage holders who purchased more recently,” ICE noted.
Buyers who made small down payments are most likely to have no equity, with close to 5 percent of VA mortgages and 2.6 percent of FHA loans underwater.
Only 3.2 percent of homeowners were delinquent on their mortgage payments in May, close to the all-time low.
Mortgage delinquencies by loan type
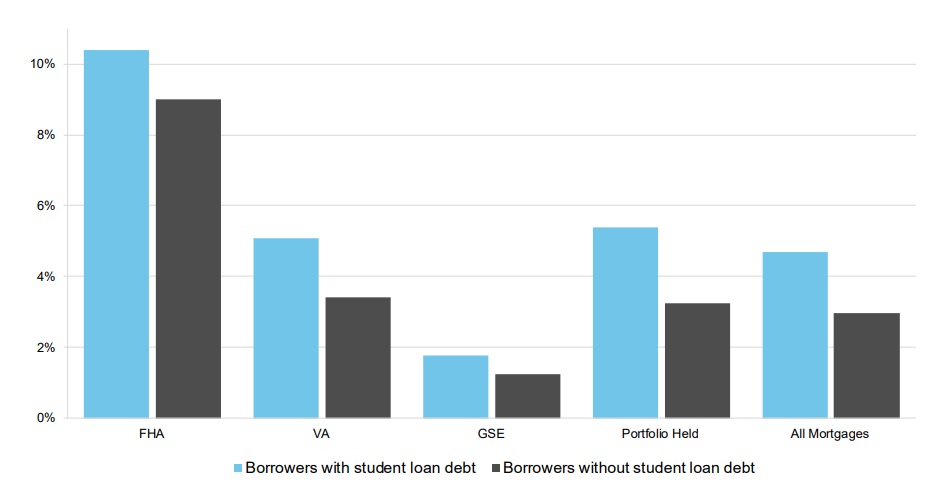
Source: ICE McDash and Tradelines powered by TransUnion.
While delinquency rates are low on portfolio loans made by private lenders and “GSE” loans backed by Fannie Mae and Freddie Mac, late payments on FHA and VA loans have been on the rise.
One issue among those borrowers is student loan debt. After pausing collections on defaulted student loans during the pandemic, the Department of Education resumed those efforts in May.
Nearly 30 percent of FHA borrowers and 20 percent of VA borrowers also have student loan debt.

Tim Bowler
“We’re seeing early signs of risk building within specific markets and within specific borrower populations, like borrowers with limited equity or who are behind on student loans,” ICE Mortgage Technology President Tim Bowler said, in a statement. “This is when proactive monitoring and data-driven risk management become essential. Identifying and engaging these borrowers early may prevent hardship later.”
Get Inman’s Mortgage Brief Newsletter delivered right to your inbox. A weekly roundup of all the biggest news in the world of mortgages and closings delivered every Wednesday. Click here to subscribe.


